Posted on 20 October 2023 by Jeff Fuge | Reading time 1 min
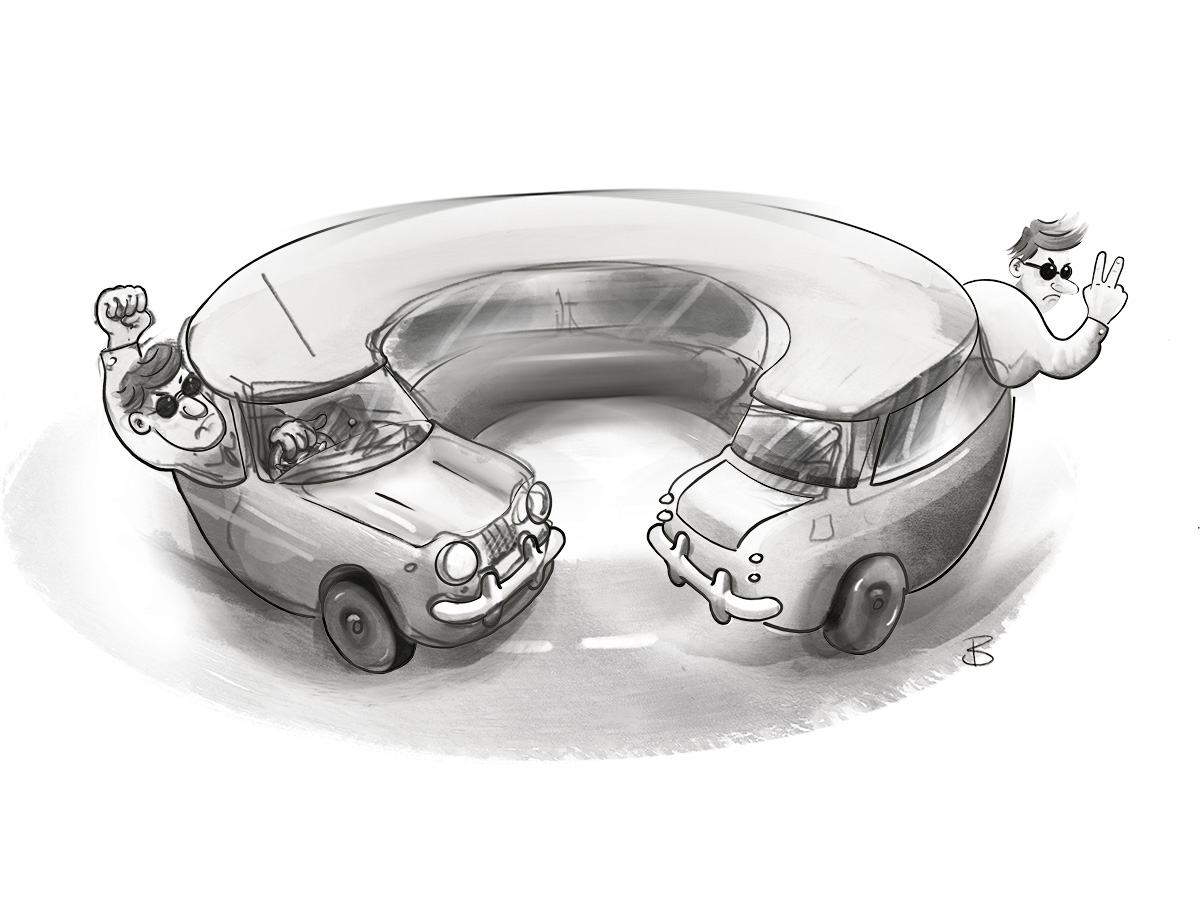
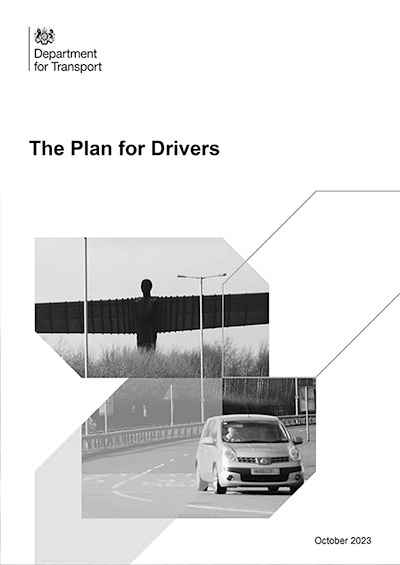
The government’s new Plan for Drivers has been driving me mad. For starters, while trying to send a message of “We love motorists”, it fails to realise the statistics it uses show that even most motorists hate motorists!

The Plan for Drivers includes a section on Inconsiderate Driving. It features a survey of what motorists hate most about other motorists, listing the top ten types of bad driving that most upset people.
Responses range from not pulling over for emergency vehicles, to middle-lane hogging, and drivers overtaking then going slowly. However, the stats that grabbed my attention were the two at the top of the list.
51% of drivers hate drivers in front who brake suddenly to scare them.
50% of drivers hate drivers who tailgate them.
While cited as motorists’ most prominent peeves, no specific comment is made in the plan about these figures and what they represent.
The old chestnut “I’m a great driver… not like that slow sod in front or that impatient idiot behind!” seems to sum it up pretty well.
Another popular pet hate among drivers is other drivers using offensive hand gestures towards them. Again, other than quoting the stat, the plan seems to stick two fingers up to the idea of interpreting what this says about driving standards, the attitude of drivers towards fellow road users, or how to improve matters.
As such, it’s pretty much a plan without out plan.
Informed critics of the Plan for Drivers include the Chartered Institute for Highways & Transport, a body representing professionals who plan, design, build, manage, maintain and operate transport and infrastructure. They say the UK “must take a analytical approach to transport policy and this plan only appears to be seeking to generate political headlines.”
Being analytical surely starts with showing you understand the numbers and stats you are quoting. There is little of that here, but it’s part of a widespread problem.
Largely, we trust the numbers put in front of us but should not be blinded by them.
For example, we assume quoted and equated numbers and to be correct, especially if presented in a formal or authoritative way. I expanded on this in my Numbers Count post a while back, as sometimes the figures we trust just don’t add up.
We also take stats to be meaningful and relevant without questioning their meaning or relevance. In the same sort of way that GCSE maths students are rewarded for showing their working out even if they get the wrong answer, we seem to subconsciously believe a conclusion or proposal is more robust given the mere presence of a survey.
Here, the government are presenting a survey about motoring annoyances and follow it with a small list of actions. Their chief action is the roll-out of noise detection cameras. Noise nuisance from excessively loud vehicles is certainly a headache (especially if you are unfortnuate enough to live next door to a car with an insanely loud muffler), but it’s not one of the gripes mentioned by drivers in the survey results.
It doesn’t take a GSCE maths examiner to figure out that noise detection cameras are a solution to a different question than the ten the plan states that drivers would most like answered.
It’s enough to drive anyone around the bend!
